


Browser-Based Time-Series Data Visualization for Industrial IoT
aptpod Visual M2M Data Visualizer turns live intdash data streams and stored measurements into configurable browser dashboards with graphs, GPS maps, synchronized media and CSV export.
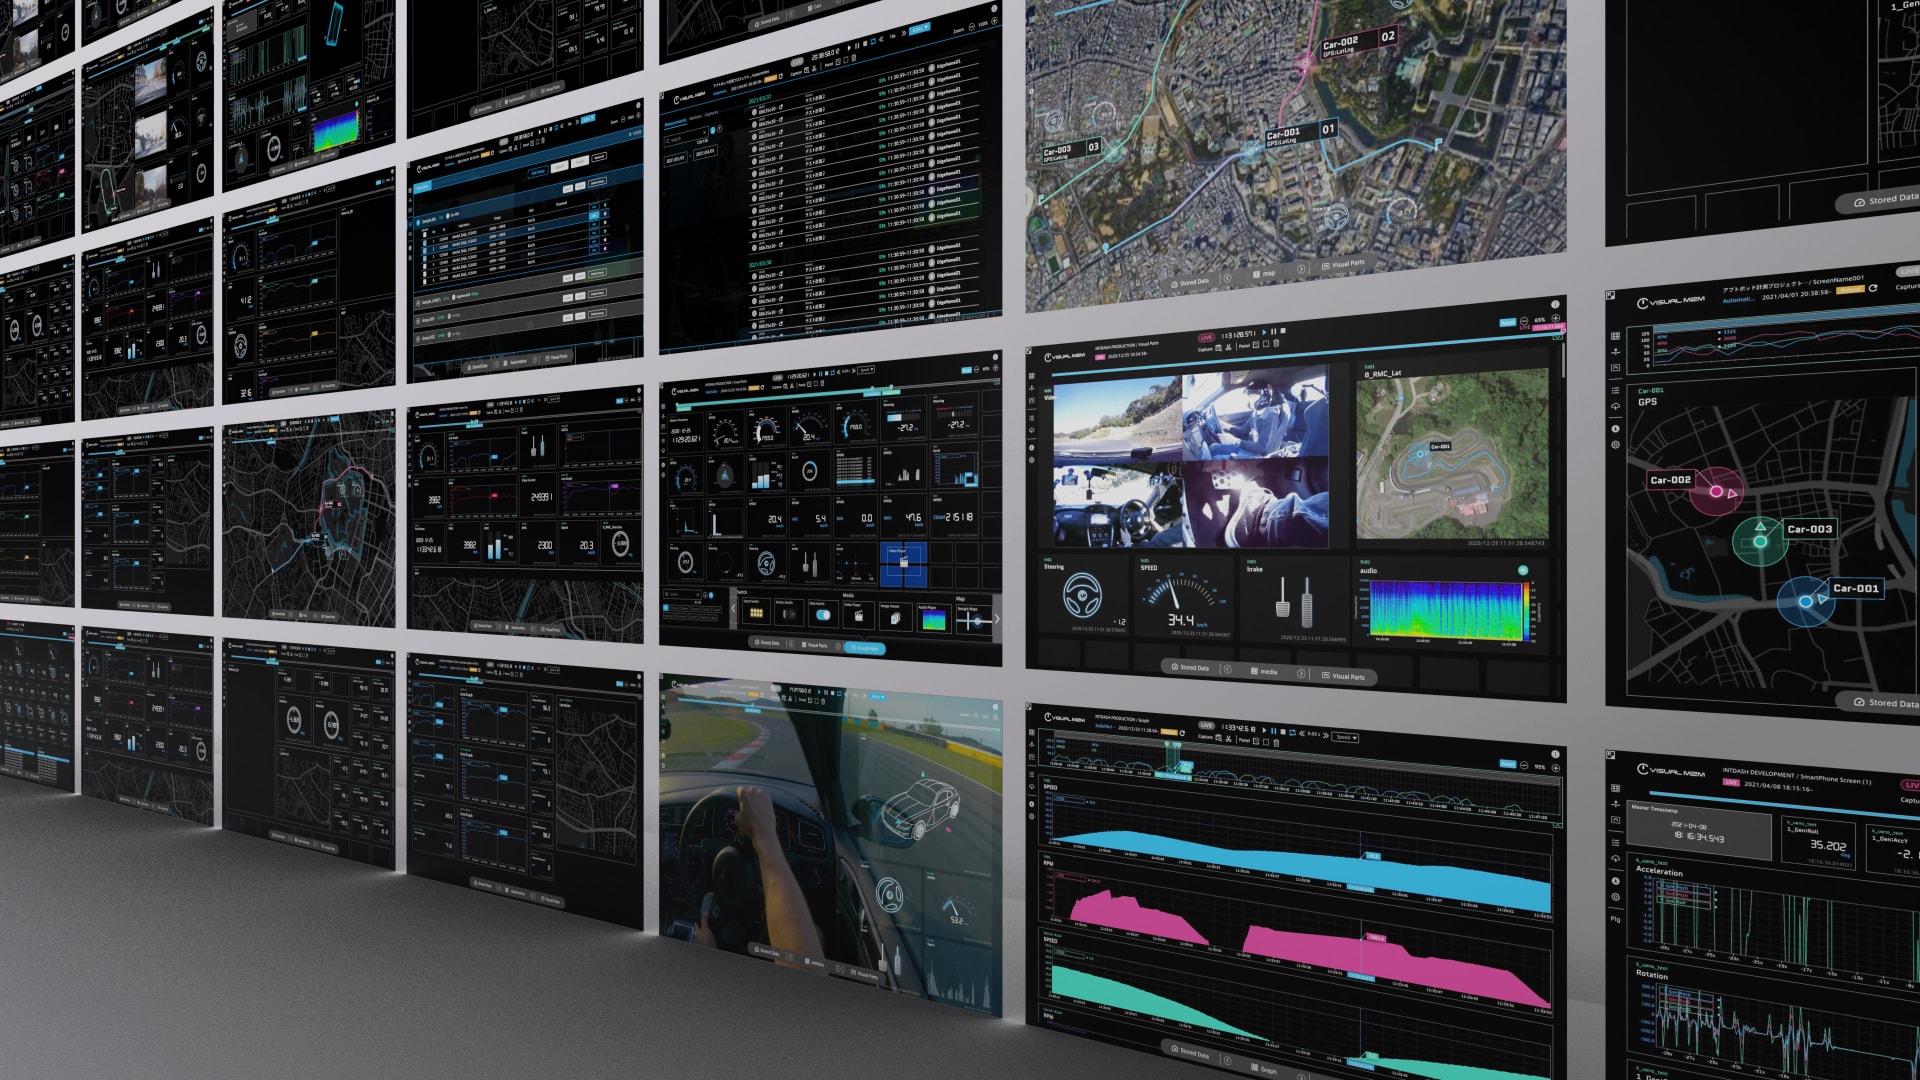
Visual M2M is designed for engineers working with vehicle telemetry, industrial sensors and other high-frequency time-series datasets. Users can build dashboards by combining data sources and visualization components using drag-and-drop operations.
Real-Time
Live data and statistics visualization
Playback
Historical data and synchronized media
GPS Maps
Location and fleet-data visualization
CSV Export
Download measured and converted data
Dashboard widgets support text, meters, graphs, histograms, scatter plots, GPS traces, video, audio and 2D or 3D model displays. Data from multiple devices can be shown side-by-side to compare performance or monitor fleets.
The application retrieves historical datasets from the intdash datastore, supports time-range selection and tagging, and can translate CAN binary messages into engineering values when appropriate data-definition files are supplied.
Drag-and-Drop Dashboards
Build browser-based displays by placing data sources and visualization components on configurable panels.
Live and Historical Trend Analysis
Show incoming time-series measurements and replay archived data with timeline-based graphs.
GPS Mapping and Fleet Views
Map location traces and compare operational data from multiple vehicles or field devices.
Synchronized Video and Audio
Review video, audio and sensor streams along a common time axis for event investigation.
CAN Signal Decoding
Convert binary CAN fields into physical values with an appropriate data-definition file.
Data Tagging and CSV Export
Find relevant time intervals, examine measurement statistics and export selected data as CSV files.
Vehicle CAN Data Visualization
Display decoded CAN signals, sensor values and test measurements on live or historical dashboards.
Fleet and Equipment Monitoring
View multiple connected vehicles or machines together and inspect their operating conditions.
GPS Route and Event Analysis
Correlate location traces with measurement events and changes in equipment behavior.
Synchronized Video Investigation
Replay camera footage alongside control and sensor signals during fault analysis.
Industrial Time-Series Analysis
Compare trends, statistics and measurements across devices or production equipment.
Research and Validation Reporting
Review archived test data and export selected measurements for further engineering analysis.
| Capability | Published Description |
|---|---|
| Product Type | Web-based data visualization dashboard application |
| Data Platform | intdash streaming pipeline and stored time-series measurements |
| Dashboard Creation | Drag-and-drop visual components |
| Live Data Display | Real-time streams, measurements, graphs and statistics |
| Historical Data | Time-range loading and playback from intdash storage |
| Graph Types | Timeline graphs, meters, histograms and scatter plots |
| Geospatial Visualization | GPS mapping, trajectories and multi-device fleet views |
| Media Synchronization | Synchronized video, audio, images and sensor data |
| Data Representation | Text, graphs, maps, 2D and 3D models |
| CAN Conversion | Binary signal conversion using external data-definition files |
| Data Organization | Tagging, searching and selected time-range access |
| Export | CSV download of measurement and converted data |
Visual M2M visualizes data available through intdash; ingestion, data rates, supported formats and optional visualization components depend on the deployed platform and configuration.