

Lighting Measurement & Reporting App
Remote Measurement Support via Dedicated App
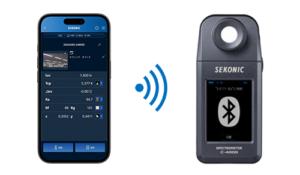
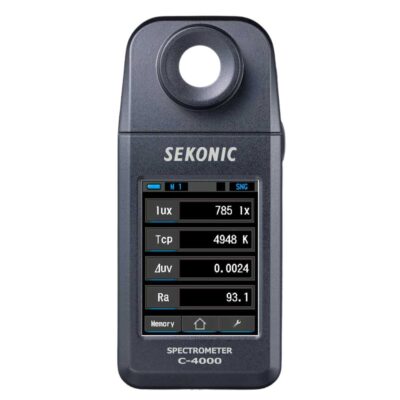
A dedicated application designed to maximize the performance of the C-4000 Spectrometer.
The app allows users to remotely control the instrument, enabling more flexible and efficient measurement operations.
Users can choose between single measurement and continuous measurement modes.
In continuous mode, measurements can be monitored in real time, making it ideal for dynamic lighting evaluation and ongoing measurement tasks.
Visualization of Measurement Data with Graphs
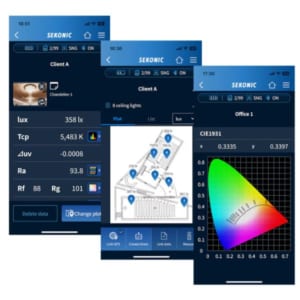
While the C-4000 displays measurement values as text on the device itself, the SEKONIC LD app enables users to visualize measurement data through various graphs on a smartphone or tablet.
The app supports four types of graphical displays:
-
Spectral Graph
-
CRI (Color Rendering Index)
-
TM-30
-
CIE 1931 Chromaticity Coordinates
These visualizations help users analyze lighting characteristics more clearly and efficiently.